
Tools to Explore the Immune Repertoire
How the immune system changes with age is a highly relevant topic and we have investigated that in Tabula Muris Senis by building a clonal landscape of T and B cells to illustrate the diversity of the immune repertoire.
What are T and B Cells?
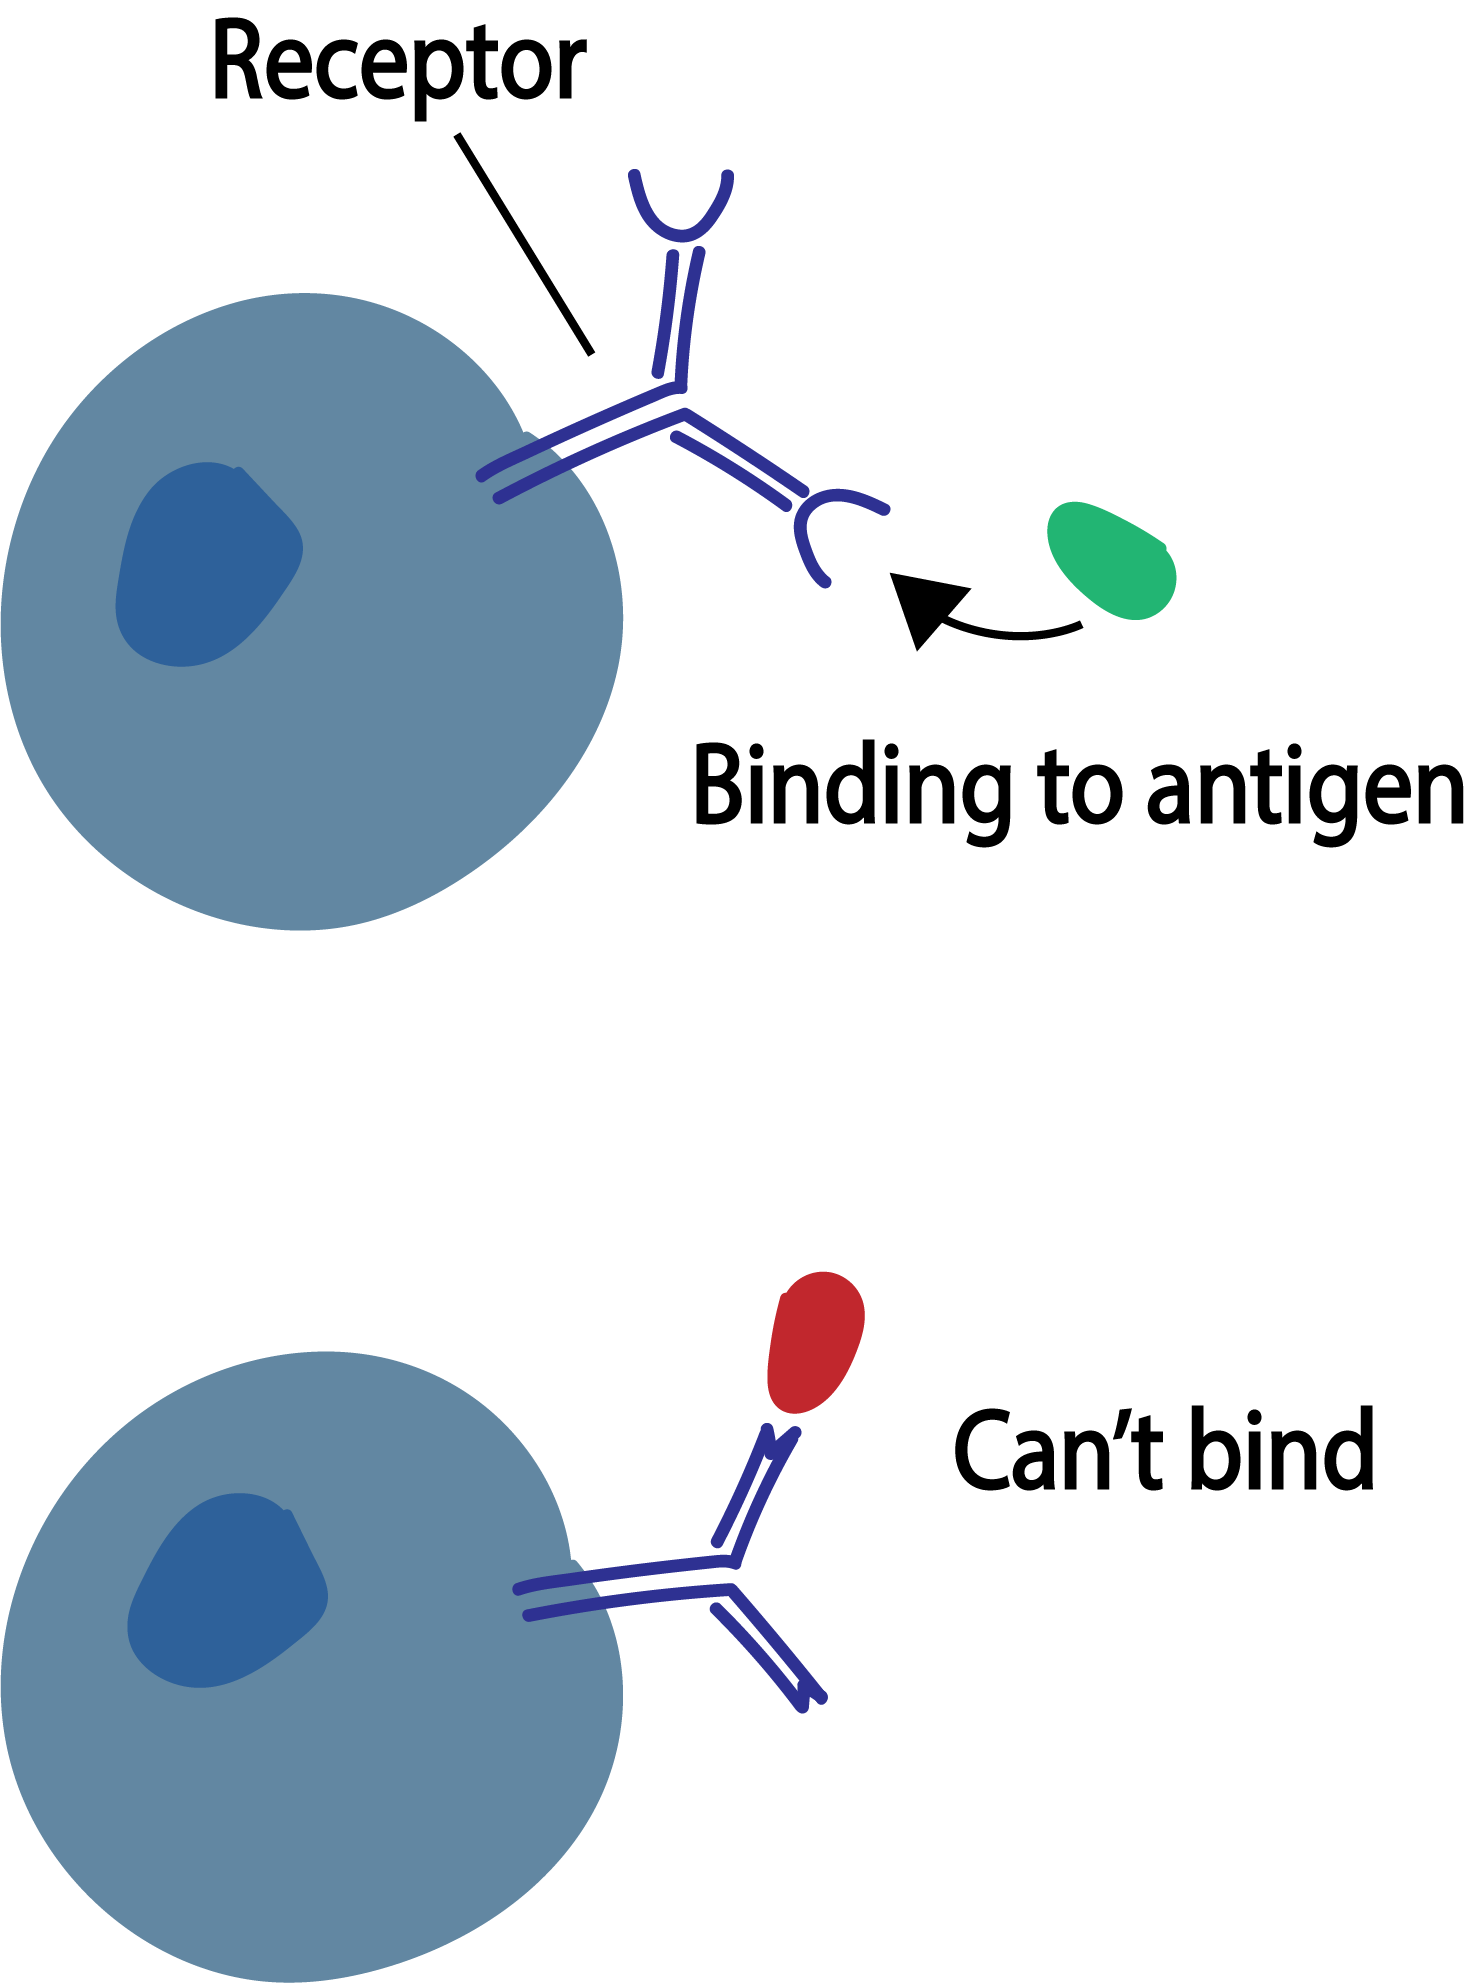
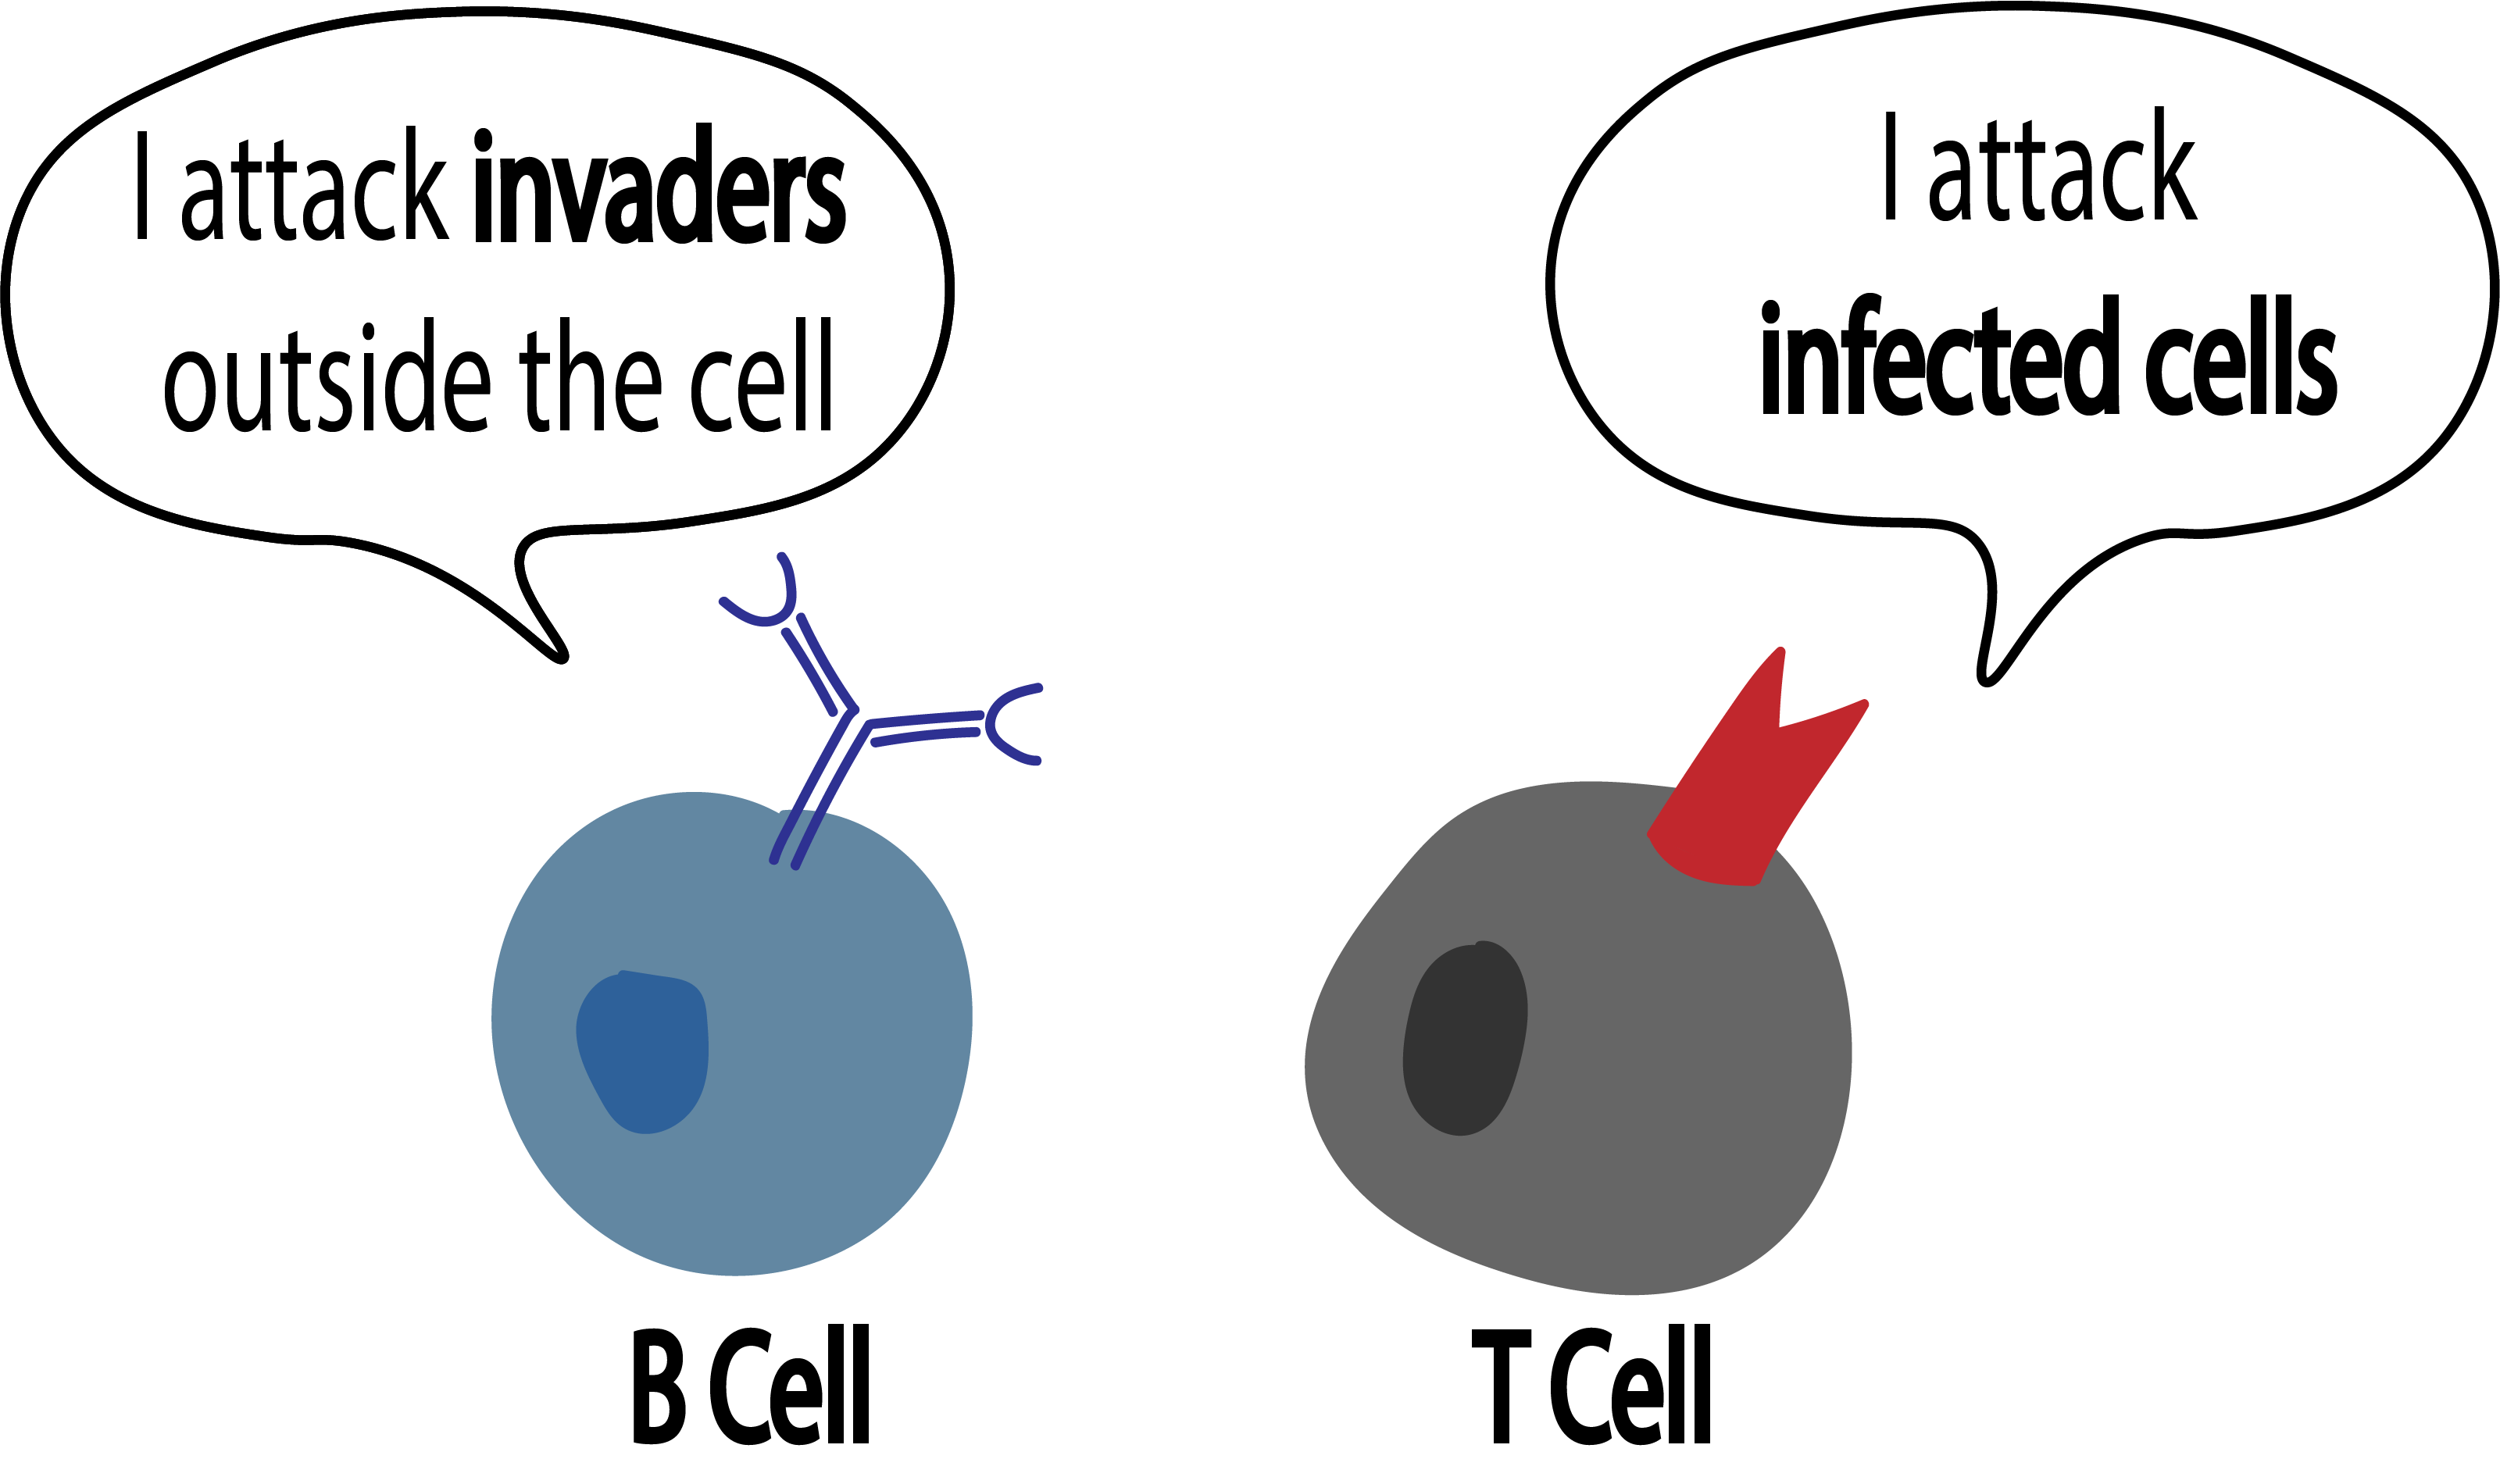
T and B cells are lymphocytes (a type of white blood cells) and active participants of the adaptive immune response. These cells use the molecules on their surface, T cell receptors (TCR) and B cell receptors (BCR), to recognize pathogens in the body, such as a virus. T and B cells undergo V(D)J recombination — a process in which their DNA is shuffled — in order to develop their receptor which can potentially recognize pathogens. TCRs and BCRs accomplish this with the unique biological code they express in which can identify only a specific antigen; it can be thought of as two puzzle pieces meant to fit together. Although T and B cells serve the same purpose as participants in the adaptive immune response, the difference therein lies in their interactions with antigen-presenting cells and clonal expansion.
A T cell attacks and kills an antigen-presenting cell directly. When the B cell receptor recognizes its cognate antigen, it secretes several free forms of its receptor (antibodies). These antibodies are what latch onto the antigen and mark it for destruction by other cells.
When T and B cells encounter antigen-presenting cells, they undergo clonal expansion — a process in which T and B cells form clones of themselves to fight off pathogens, and remember them for future encounters. It is important to note though that when B cells proliferate, their receptors undergo hypermutation — a process in which BCRs are diversified to enable the immune system to adapt its responses to new threats. These mutations occur at an extremely high rate, so during clonal expansion thousands of B cells may possess slightly different receptors. The B cell with the highest affinity towards the antigen will be selected to produce antibodies.
We choose to explore clonal expansion at the single-cell level to capture differences between the cells and make more in depth assesments of their population, which may be obscured through bulk RNA-seq. The single-cell analysis was conducted with the tools TraCeR and BraCeR.
TraCeR & BraCeR Core Functions
TraCeR and BraCeR were developed specifically to handle single-cell data. The tools serve to reconstruct the sequences of TCR and BCR genes and identify cells that have the same receptor sequence. The two modes that perform this are assemble and summarize.
-
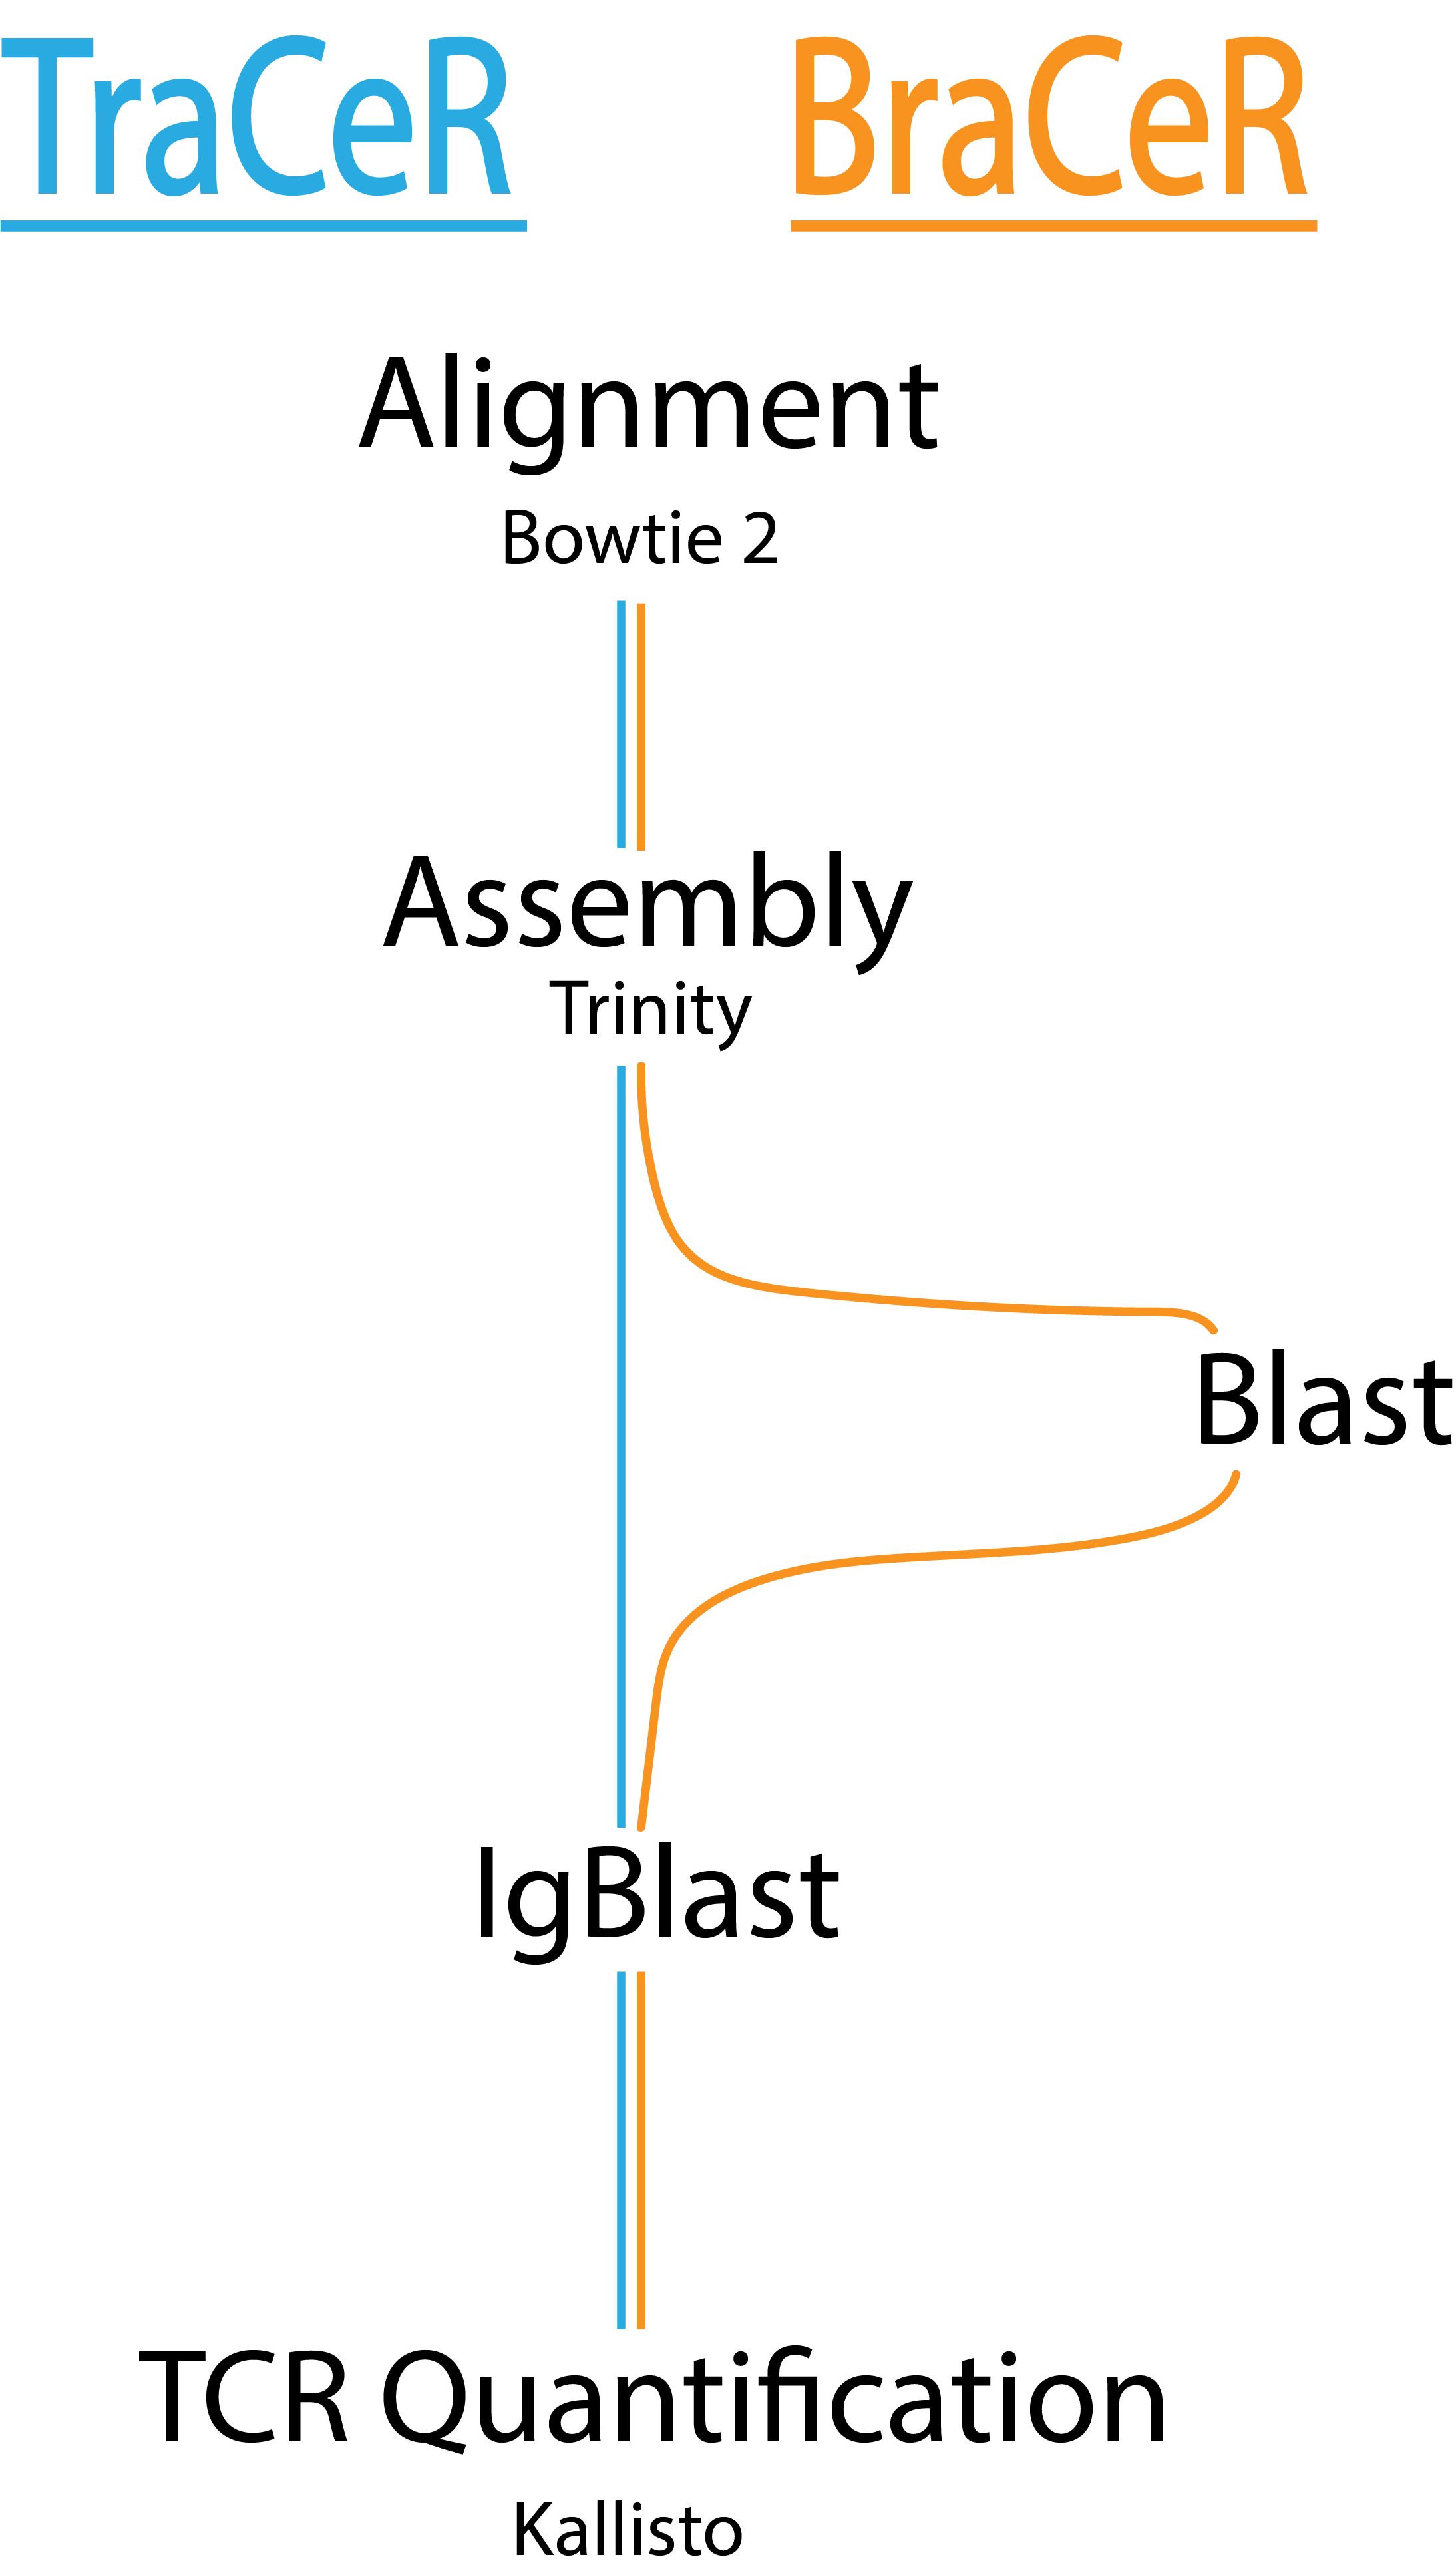
Assemble is almost identical in both TraCeR and BraCeR. They both take paired-end scRNA-seq reads and reconstruct the TCR and BCR sequences. The reconstructed sequences are used to identify cells that have the same receptor sequence. Reconstruction is accomplished with the following steps: alignment, de novo assembly, IgBlast, and TCR and BCR expression quantification. BraCeR takes an extra step to perform a BLAST search before IgBlast. For each cell, an output directory is created with output from Bowtie2, Trinity, (BLAST), IgBlast, and Kallisto as well as files describing the TCR and BCR sequences that were assembled.
-
Summarize takes the directories output from the assemble phase of several cells. Recall that B cells undergo hypermutation during clonal expansion, so the results in this step differ for TraCeR and BraCeR. In TraCeR, clone assignments are generated for each cell if they are derived from the same parent cell. In BraCeR, we receive a database file containing all the reconstructed sequences (e.g. CDR3, V and J genes).
For TraCeR, we don’t need to take any further steps after summarize, as we have the clonal groups already assigned. For BraCeR, extra steps outside of the tool are necessary to generate clone assignments. Clone assignment is accomplished as described in the methods section of the Croote et al. paper. First the antibody heavy chain variable region (VH) sequences are divided into groups which contain the same V and J genes and CDR3 length. A clone assignment is made if a cell’s amino acid CDR3 sequence shares similarity with other members within its groups. The similarity criteria is up to the investigators judgement.
Overall, these tools helps us identify single cells that have undergone clonal expansion. We previously ran TraCeR and BraCeR analysis pipelines on AWS Batch by manually submitting jobs. We submitted thousands of cells to be assembled asynchronously, then pulled the assembled cells down and summarized them to identify clonal groups. While this workflow carried out the analysis, we wanted to improve its reproducibility. Thus, we turned to Nextflow.
What is Nextflow?
Nextflow is a workflow manager which allows for scalable and reproducible scientific workflows using containers. It simplifies the implementation and deployment of complex, parallel workflows, which is necessary for the thousands of single cells we process. Because Nextflow is based on the dataflow programming model, you can effortlessly link processes together in one workflow.
Nextflow has the capability to run pipelines in the cloud (e.g. AWS Batch), on high performance compute cluster schedulers (e.g. LSF, SGE, SLURM, PBS), or locally.
The Implementation
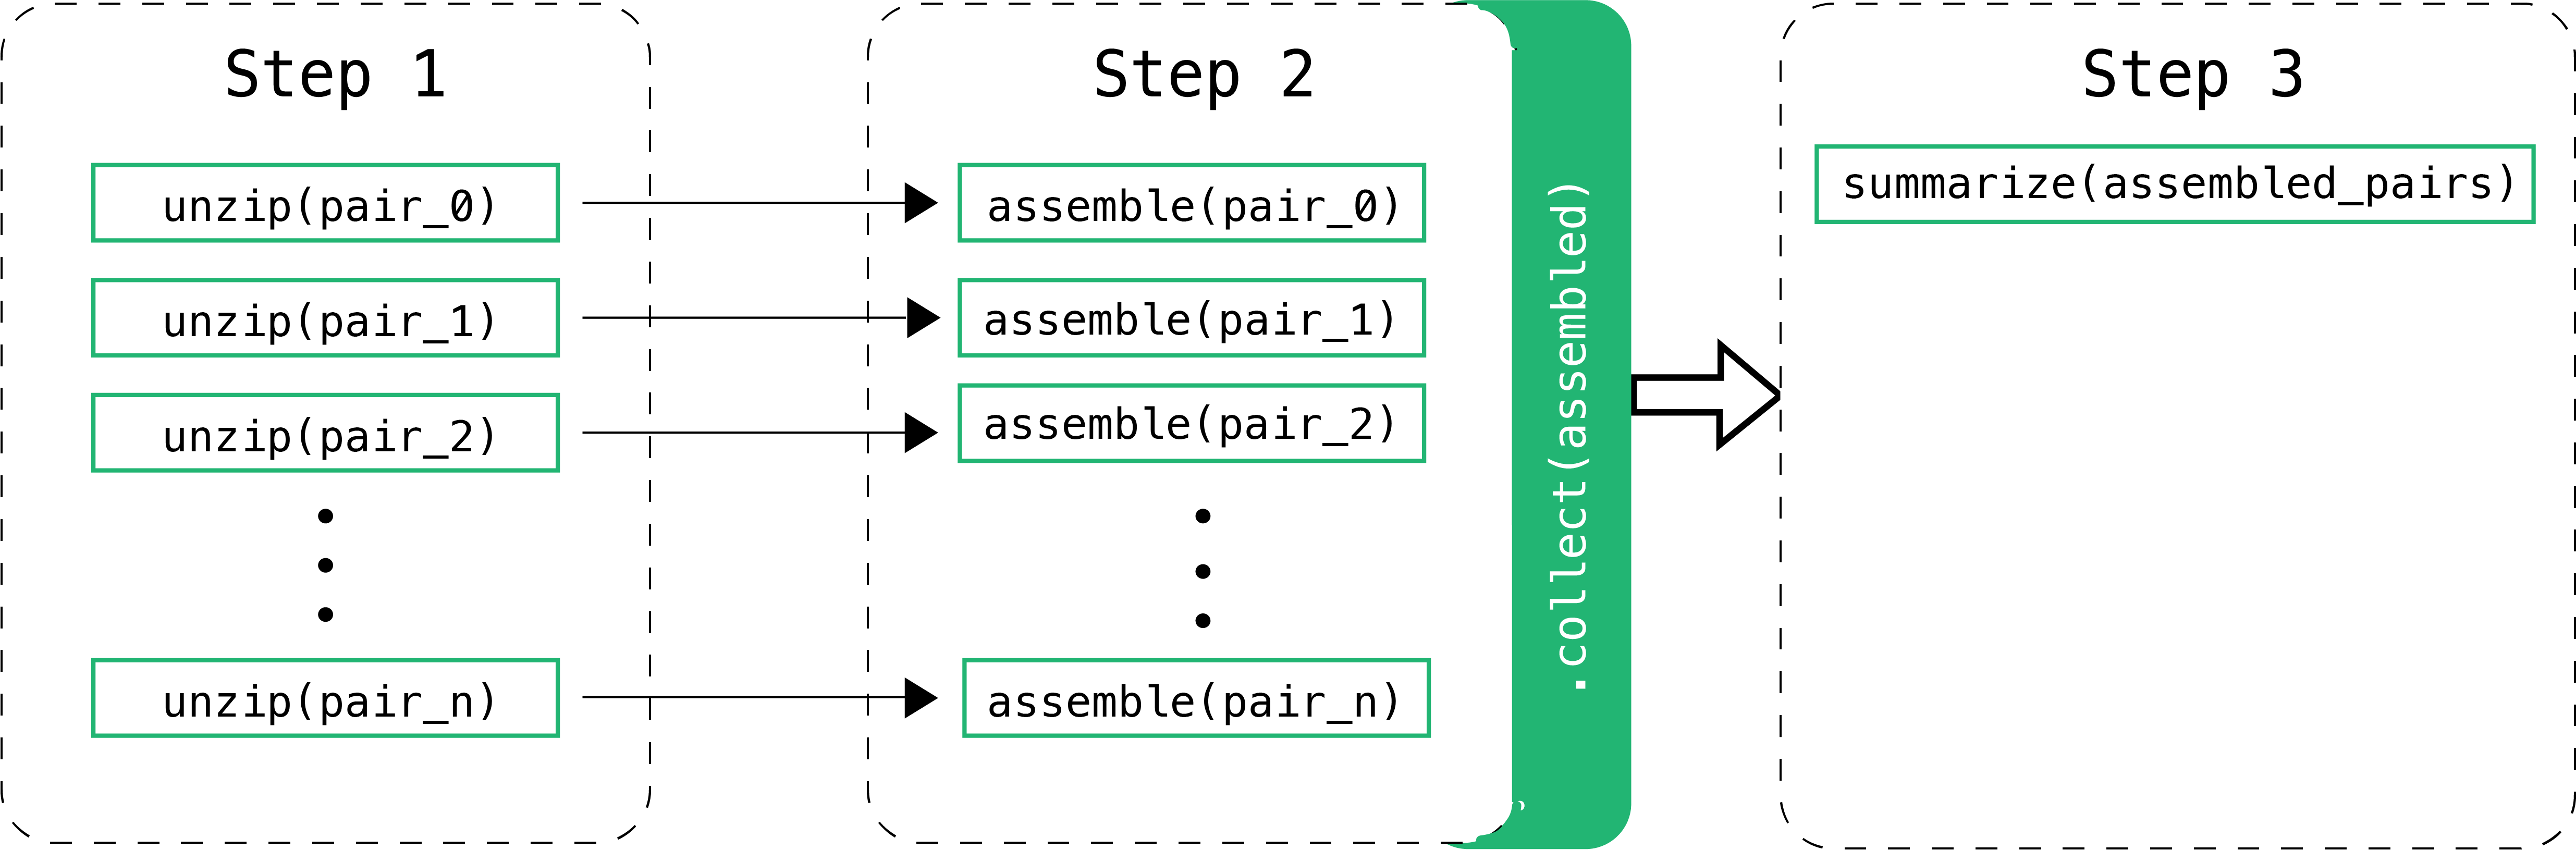
The implementation performs three steps which are linked together through Channels. A Channel has two major properties: sending messages and receiving data. A Channel sends messages in an asynchronous manner in which the operation will complete immediately, without having to wait for the receiving process. It will also receive data, which is a blocking operation where the receiving process is stopped until the message has arrived. The figure below illustrates how the workflow manages the three different steps. Steps 1 and 2 are handled asynchronously while Step 3 relies on the completion of Step 2 before starting.
Step 1: Preparation
The first step is to prepare the reads for the next processes. In this specific workflow, zipped fastq pair files are expected. Unzipping them first is necessary as the next steps only work with unzipped files.
process unzip_reads:
- The first step is to open a
Channelusing the method.fromFilePairs(). This method returns the file pairs matching the glob pattern input by the user. - The file pairs get unzipped and passed into a new
Channel, reads_unzipped_ch, for the following process.
Step 2: Assembly
In this step, we assemble the reads with either TraCeR or BraCeR.
process assemble:
- This process takes in the unzipped fastq files from
reads_unzipped_chand reconstructs the TCR or BCR sequences, depending which analysis is being ran. - The reads are assembled asynchronously and the output folders are published to a user-specified directory.
- These same folders are also passed into a new
Channel, assembled_ch, which will be used for the last process.
Step 3: Summarize
Finally, in this last step we generate summary statistics and begin clone assignment.
process summarize:
- This last process calls the method
.collect()onassembled_ch. This method collects all the files emitted fromassembled_chinto a list and uses that as input for this process. - Summarize mode is ran and the output is published to the same directory where the assembled files are.
The figure below illustrates a Nextflow run with TraCeR.
Step 4: Visualization
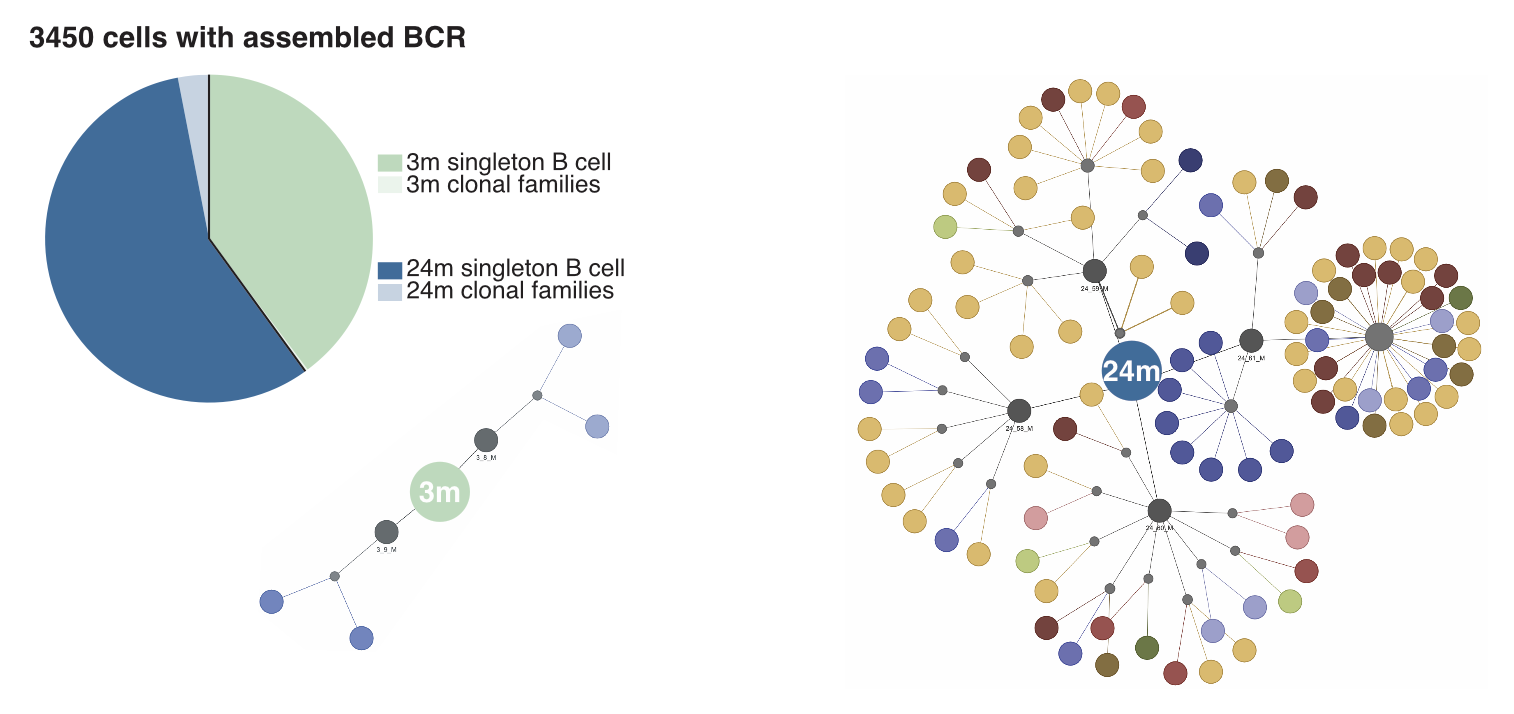
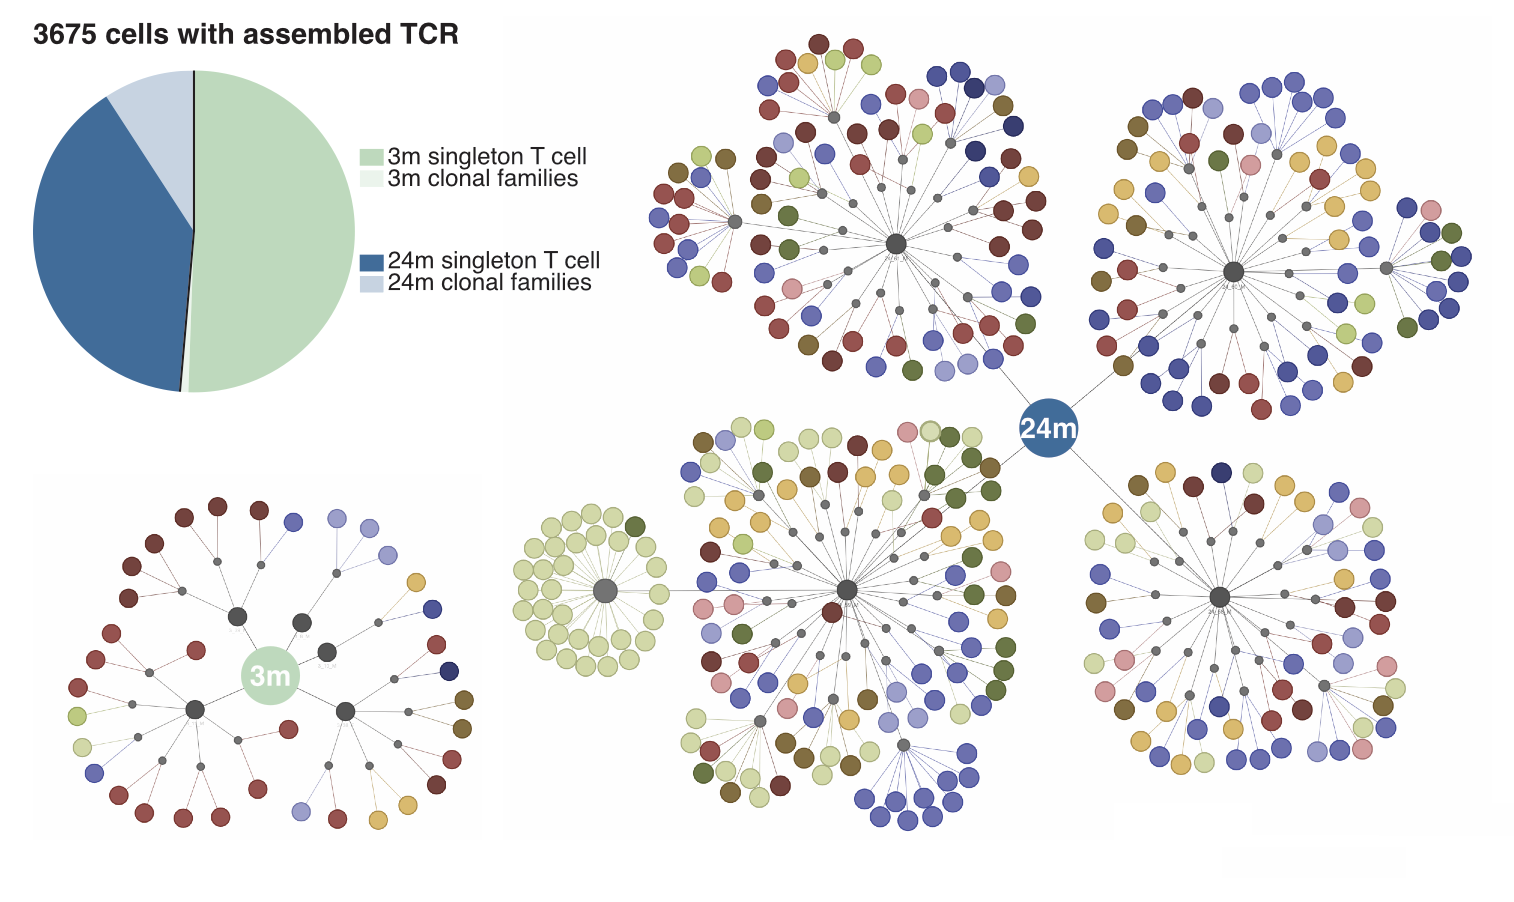
Different visualizations you could create with output from TraCeR and BraCeR include clonal trees, clonal networks, pie charts, etc. A clonal network can help visualize the landscape of a cell population’s clonal groups. For example, in the figures below we visualize the landscape of Tabula Muris Senis dataset by observing the number of clones for two age groups: 3 months and 24 months. This network shows us that the number of clones has increased with age. If we look at the distribution of clonal cells vs. singletons (non-clonal cells) through a pie chart instead, we see that the ratios of singletons to clonal cells have changed.

Conclusion
Single-cell analyses are key in investigating clonal expansion; however, with the growing number of datasets it has become increasingly difficult to create reproducible workflows to handle them. When implemented together, these tools enable scientists to conduct large and complex analyses in a single, effortless workflow, allowing for the production of easy to interpret visualizations.
Our example illustrates how to use as a way of exploring the immune repertoire and its diversity, but the scope of such tools is far larger and key to reproducible science in the age of big (single-cell) datasets!